Monday, January 24, 2011

LAST POST =) my EXCELency
SCATTER PLOT IN EXCEL
Introduction:

Introduction

Linear Regression lines can be used as a way of visually depicting the relationship between the independent (x) and dependent (y) variables in the graph. A straight line depicts a linear trend in the data (i.e., the equation describing the line is of first order. For example, y = 3x + 4. There are no squared or cubed variables in this equation). A curved line represents a trend described by a higher order equation (e.g., y = 2x2 + 5x - 8). It is important that you are able to defend your use of either a straight or curved regression line. That is, the theory underlying your lab should indicate whether the relationship of the independent and dependent variables should be linear or non-linear.


PART 1 : BEER'S LAW SCATTER PLOT AND LINEAR REGRESSION


Beer's Law states that there is a linear relationship between concentration of a colored compound in solution and the light absorption of the solution. This fact can be used to calculate the concentration of unknown solutions, given their absorption readings. First, a series of solutions of known concentration are tested for their absorption level. Next, a scatter plot is made of this empirical data and a linear regression line is fitted to the data. This regression line can be expressed as a formula and used to calculate the concentration of unknown solution.


PART 2: TITRATION DATA PLOTTING

Creating a Scatter Plot of Titration Data

In this next part of the tutorial, we will work with another set of data. In this case, it is of a strong acid-strong base titration. With this titration, a strong base (NaOH) of known concentration is added to a strong acid (also of known concentration, in this case). As the strong base is added to solution, its OH- ions bind with the free H+ions of the acid. An equivalence point is reached when there are no free OH- nor H+ ions in the solution. This equivalence point can be found with a color indicator in the solution or through a pH titration curve.
This part of the tutorial will show you how to do the latter.
Note that there should be two columns of data in your spreadsheet:


Column A: mL of 0.1 M NaOH added  
Column B: 
 pH of the 0.1 M HCl / 0.1M NaOH mixture


TUTORIAL:


LINE BEST FIT

SAMPLE ON QUADRATIC REGRESSION

Lastly :)

Tuesday, January 11, 2011

Word Of the Day : SMILES =)


SMILES
The simplified molecular input line entry specification or SMILES is a specification for unambiguously describing the structure of chemical molecules using short ASCII strings. SMILES strings can be imported by most molecule editors for conversion back into two-dimensional drawings or three-dimensional models of the molecules.

The term SMILES refers to a line notation for encoding molecular structures and specific instances should strictly be called SMILES strings. However, the term SMILES is also commonly used to refer to both a single SMILES string and a number of SMILES strings; the exact meaning is usually apparent from the context. The terms Canonical and Isomeric can lead to some confusion when applied to SMILES. The terms describe different attributes of SMILES strings and are not mutually exclusive.
Typically, a number of equally valid SMILES can be written for a molecule. For example, CCO, OCC and C(O)C all specify the structure of ethanol. Algorithms have been developed to ensure the same SMILES is generated for a molecule regardless of the order of atoms in the structure. This SMILES is unique for each structure, although dependent on the canonicalisation algorithm used to generate it, and is termed the Canonical SMILES. These algorithms first convert the SMILES to an internal representation of the molecular structure and do not simply manipulate strings as is sometimes thought. Various algorithms for generating Canonical SMILES have been developed, including those by Daylight Chemical Information Systems, OpenEye Scientific Software, MEDIT and Chemical Computing Group. A common application of Canonical SMILES is indexing and ensuring uniqueness of molecules in a database.

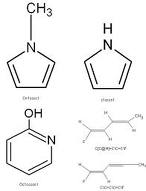
EXAMPLES :


TERMS AND MEANINGS:

TERM MEANINGS                                                                                                                       
Rings To write a cyclic or ring structure, you "break" one of the bonds and write the structure as a line having digits following the atoms in the broken bond. Thus the SMILES for cyclohexane is C1CCCCC1. If a given atom is part of more than one ring structure, and you have to break more than one bond, you then use a different digit for each broken bond, in order to convey how to re-join the atoms.

By convention, aromatic ring vertices are written in lowercase. Thus the SMILES for benzene is c1ccccc1 and that for pyridine is n1ccccc1.
Charges and positions of atoms Charge signs (+ and -) and digits giving the multiple of a charge or the position of an atom are the adjectives (and sometimes the adverbs) of SMILES grammar. An ionic valence is a classic application. For example, [Fe+2] is the ferrous or iron (II) ion. Note that SMILES does not require, nor use, superscripts or subscripts.

One does not multiply atoms themselves (except for atoms of hydrogen) by using numbers. Instead, one repeats the atomic symbol as many times as the atom appears.
Bonds Bonds are the verbs of the SMILES grammar.To simplify things even further, one may omit the - and : symbols for atoms that are adjacent to one another and have single or aromatic bonds joining them. This is the reason for representing an aromatically bound atom in lowercase instead of in UPPERCASE.

Thus the SMILES for diatomic oxygen is O=O; that for carbon dioxide is O=C=O; for diatomic nitrogen, N#N; for hydrogen cyanide, C#N; for acetylene or ethyne, C#C; for hydrazine, N=N.
Branches Branches are the subordinating conjunctions of the SMILES grammar. A structure that branches from the main line is enclosed in parentheses. Nesting and stacking of branches is permitted. An atom other than carbon in a linear structure would also receive a branch. Thus the SMILES for chloromethane (formerly called "methyl chloride") would be C(Cl), and that for tetrachloromethane ("carbon tetrachloride") would be C(Cl)(Cl)(Cl)(Cl).

FOR MORE INFO CLICK HERE.

Tuesday, January 4, 2011

Protein Data Bank

The Protein Data Bank (PDB) is a repository for the 3-D structural data of large biological molecules, such as proteins and nucleic acids. The data, typically obtained by X-ray crystallography or NMR spectroscopy and submitted by biologists and biochemists from around the world, are freely accessible on the internet. The PDB is overseen by an organization called the Worldwide Protein Data Bank, wwPDB.
The PDB is a key resource in areas of structural biology, such as structural genomics. Most major scientific journals, and some funding agencies, such as the NIH in the USA, now require scientists to submit their structure data to the PDB. If the contents of the PDB are thought of as primary data, then there are hundreds of derived (i.e., secondary) databases that categorize the data differently. For example, both SCOP and CATH categorize structures according to type of structure and assumed evolutionary relations; GO categorize structures based on genes.


3D Modeling Compund Summary
FtsH peptidase

Gene Ontology

EC#:3.6.5.4


Authors:   Estrozi, L.F.,   Boehringer, D.,   Shan, S.-O.,   Ban, N.,   Schaffitzel, C.

Method:   ELECTRON MICROSCOPY

Chains:A

THERMOLYSIN

Gene Ontology


EC#:3.4.24.27


Authors:   Juers, D.H.,   Weik, M.

Method:   X-RAY DIFFRACTION

Chains:E

Leucyl Aminopeptidase

Gene Ontology


EC#:3.4.11.1 

Authors:   Kale, A.,   Dijkstra, B.W.,   Sonke, T.,   Thunnissen, A.M.W.H

Method:   X-RAY DIFFRACTION

Chains:A, B, C, D, E, F


Click Here for more info.